Posts from the ‘Blog’ category

“Reconstructing a Sacred Barrier: Testing the Virtual Waters of 3D Modeling”

The following is a lightning talk I gave on February 6, 2016 as part of the NYCDH Week Kickoff Gathering at Fordham University. It’s an update on my process and progress since beginning the project I detailed in the previous post.

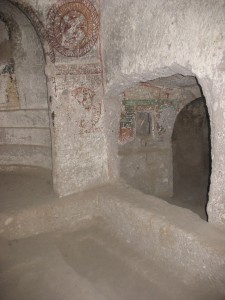
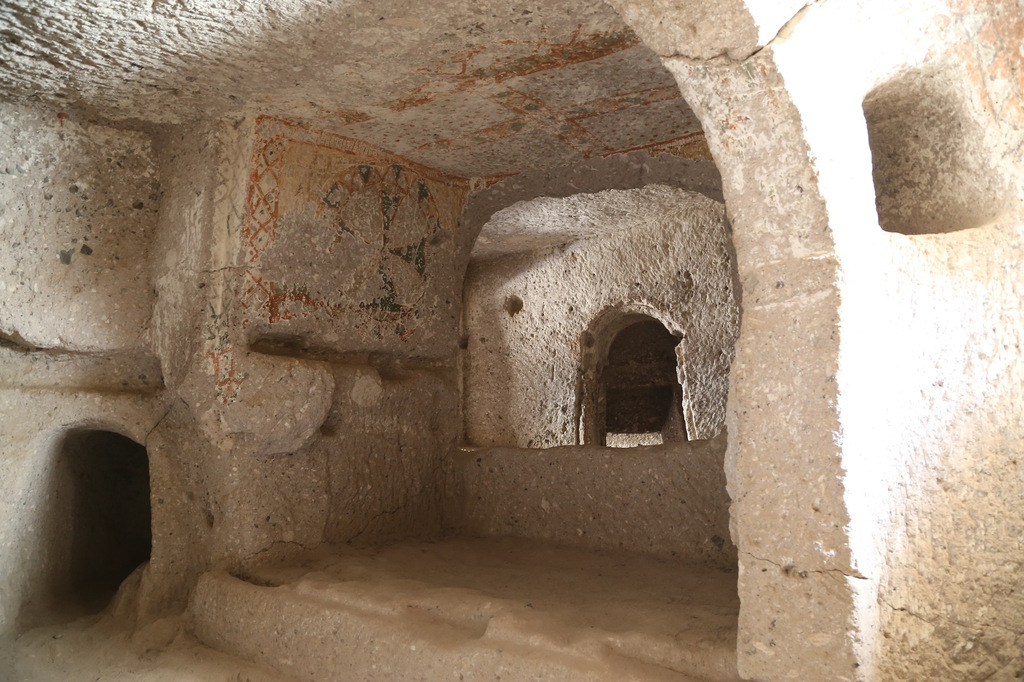
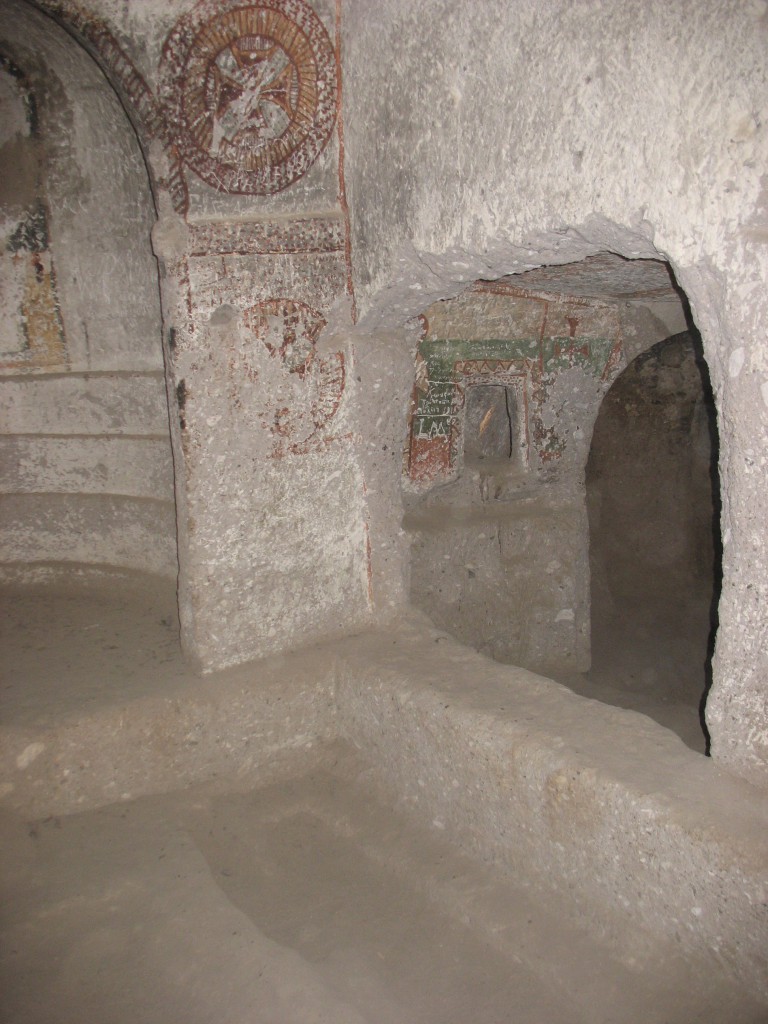
A damaged wall that once separated a chapel from a tomb chamber in Karabaş Church.

A damaged wall that once separated a chapel from a tomb chamber in Karabaş Church.

I work on Byzantine rock-cut architecture in Cappadocia, a region in Turkey. Essentially my work is phenomenology, trying to decipher the lived experience in medieval monuments that are now abandoned, often badly damaged. At the heart of it, my work is about seeing—hopefully as the Byzantines did—using technology to “see” what is no longer there anymore, to notice details and re-imagine spaces that were once full of people and music and chanting and colorful clothing and flickering candlelight.

As you can see here (above), now most of them are full of dust.

3Jerphanion_pl3_Karabas_tomb_images copy 2

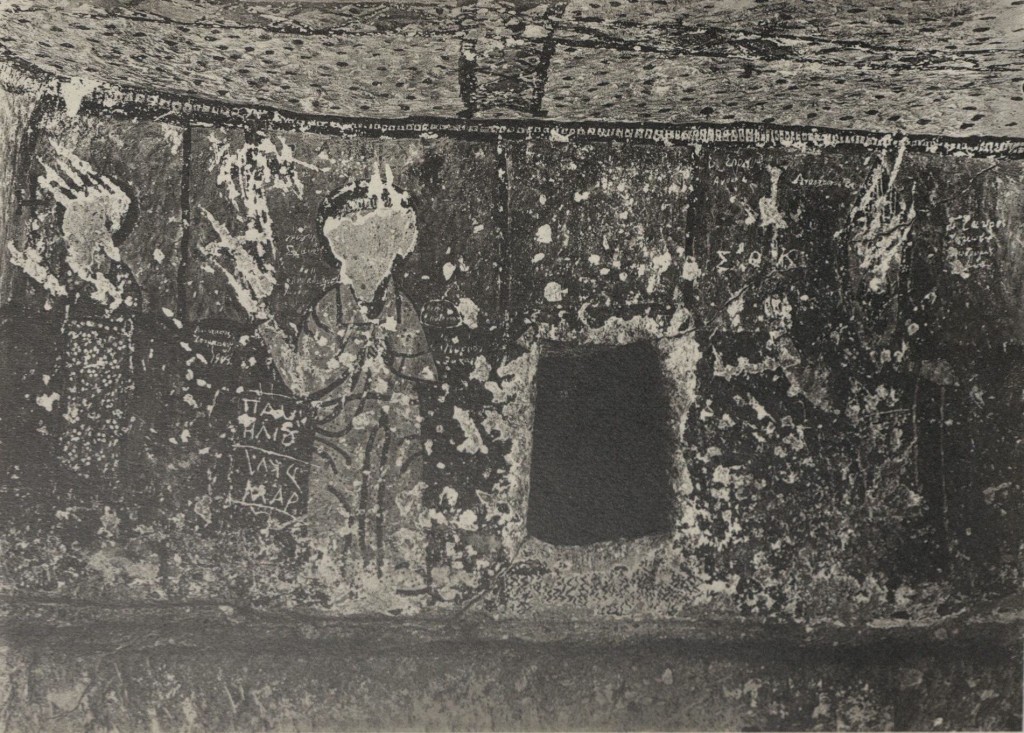
Guillaume de Jerphanion’s early twenthieth-century photo of the tomb wall.

My NYC-DH project will take my photos of a ninth-century chapel (with a tomb wall that was destroyed in the 1980s) and merge them with historical photos of the tomb wall intact. (See Jerphanion’s image, above).

This is still a work in progress.

The ultimate goal is to determine what viewers would have seen from a small window in the wall, from either side. This is part of a larger experiment wherein I model Cappadocian spaces using a variety of tools and techniques—photogrammetry, vector illustration or polygon mesh models, even pencil sketches and digital photographs—in order to capture the essence of a space.

Screen Shot 2016-02-08 at 10.10.34 PM

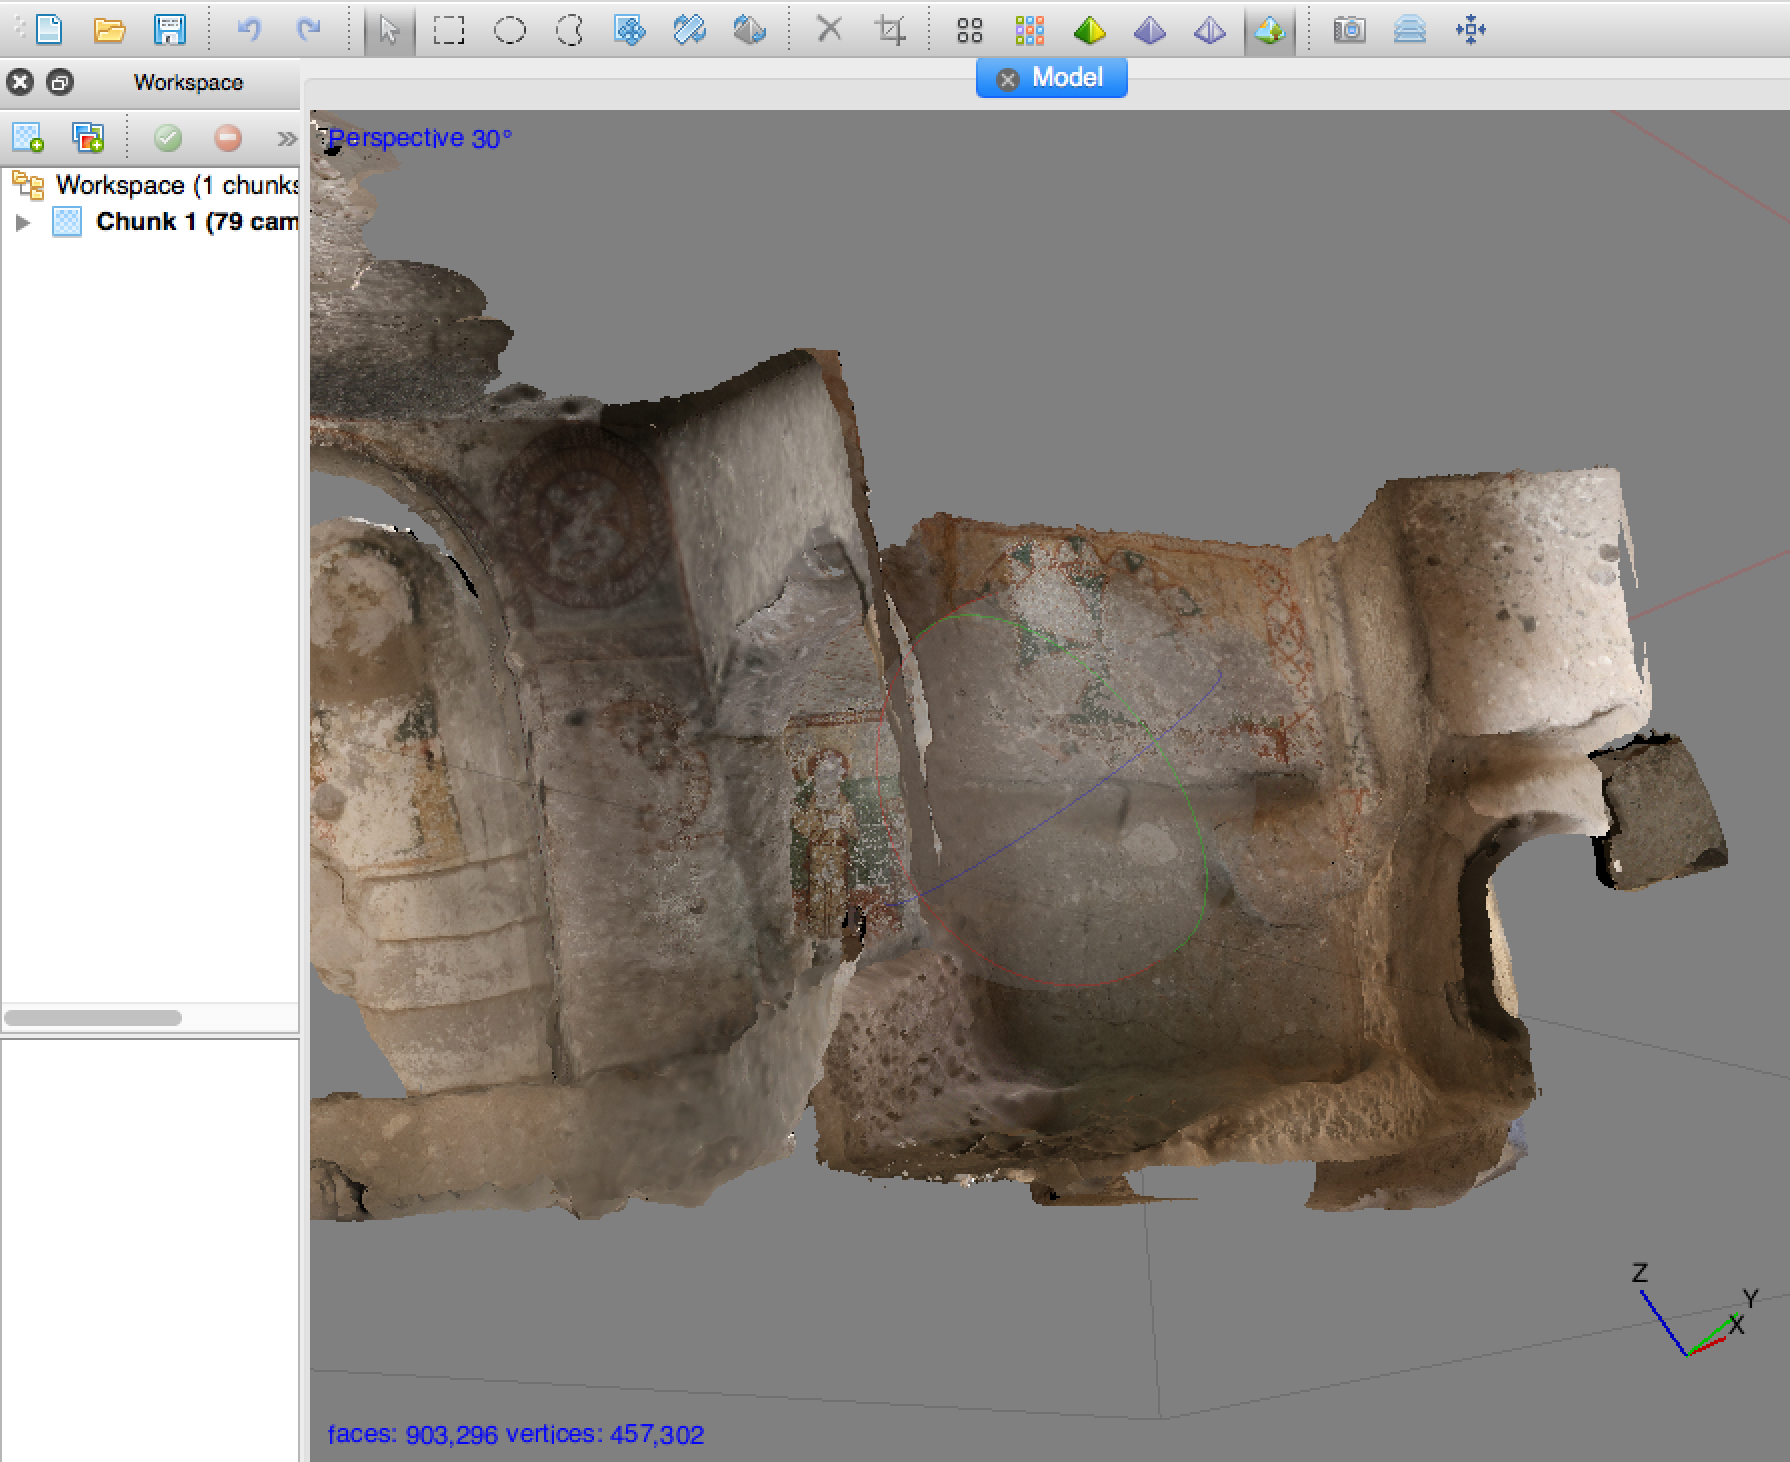
Screenshot of photogrammetry of the Karabas tomb; historical photos were not successfully integrated into the model.

This is a screenshot (above) of a first attempt at merging these two sets of photos using photogrammetry software to “stitch” them together and create an interactive model.

So far, my models aren’t pretty. But I’m here to argue that actually the process, the technique of creating a model is how we learn to see. The beauty, the quality of the replica is actually less important than what we learn from doing things that the space guides us to articulate or emphasize.

My original photogrammetry experiment didn’t work. That’s okay! I attempted to use historical photos within AgiSoft Photoscan, but the software couldn’t find a camera angle (because they’re just scans) so the older images did not register as useable data.

However, I was able to determine that the window was placed almost directly across from a niche on the opposite wall. This offers possibilities for interpretation already. And, I can use this model as background to trace the floor plan and create an architectural plan that is closer to actual scale. I can also use screenshots from the photogrammetry model when creating a vector illustration in SketchUp to achieve accurate proportions.

Sergius Test1 Feb2016
by Documenting Cappadocia
on Sketchfab


That is the next step: an illustrated model in SketchUp. The one above is a very simplified draft of a different chapel. So far it is lacking in detail and incomplete, but from it I learned a lot about how I estimated the proportions of the monument versus how they really measure up. I can start to look at the relationships between the ceiling decoration and other parts of the space.

The way we engage with ancient and medieval spaces is inevitably mediated by images of them, and by technology. We think of models as alternative or additive accessories to historical knowledge—even in our terminology: things like Virtual Reality, or Augmented Reality.

But there’s no one kind of representation that will replace lived experience. So by experiencing multiple types of modeling, and particularly by using them as interpretative rather than representative images, we see that they are also a way of breaking apart our preconceived notions about spaces and the past, revealing relationships between smaller elements and viewers.


1 Comment

The New York City Digital Humanities group (NYCDH) has granted Second Prize to my project, “Reconstructing a Sacred Barrier: Digitally Recreating a Byzantine Chapel” for its 2015 Graduate Student Digital Project Award. I’m thrilled and grateful, particularly after an encouraging and fun meeting with the other recipients and NYCDH mentors this week. I look forward to combining my own photographic data with historical photos and descriptions for a better understanding of a Byzantine monument. The post below is an excerpt from my application.

A damaged wall that once separated a chapel from a tomb chamber in Karabaş Church.

A damaged wall that once separated a chapel from a painted tomb chamber in Karabaş Church.

Project description
A tomb chamber carved alongside a chapel in a rock-cut monument called Karabaş Church (c. 9th cent) raises questions about preparation for death and the nature of commemoration in the often-neglected province of Byzantine Cappadocia. A painted cross on the flat ceiling sanctifies the tomb space from above, but scholars do not know exactly how the decoration was related to the chapel or why the tomb would have been decorated on the inside. The wall dividing the two spaces was almost completely destroyed by vandalism in the 1980s. However, a photo published in the early twentieth century reveals that the dividing wall was a sacred barrier offering visual access to the holy dead through a small window opening from the chapel into the tomb space.

Art historians have yet to decipher why visitors had access to the tomb—could worshipers actually see or touch a sarcophagus? Was the tomb’s ceiling decoration a devotional image for viewers in the chapel or was it obscured by the wall?—but a 3D model of the area can determine what was visible from the window and how the spaces were used in conjunction with one another. This space has the potential to help us deepen understanding of the relationship that Byzantine Christians had with the holy dead, whose remains were sacred relics and who were thought to act as heavenly intercessors on behalf of the living.

With virtually no surviving primary source texts or objects from medieval Cappadocia, archaeological and visual evidence in the monuments themselves is our crucial link to the past. When that evidence has been damaged, as the Karabaş tomb was, scholars are left with an even deeper lacuna of evidence. However, I argue that more frequent use of digital tools can help regain some of that lost evidence by using historical photographs to supplement current research and produce more reliable visual data.[1]

With its painted walls and ceiling, the Karabaş chapel and tomb are art historically significant. They are also an excellent example for digital humanities experimentation because there are a precious few historical photographs that can be combined with the surviving material to recreate its original design. Guillaume de Jerphanion, an early twentieth-century explorer of the region, photographed the chapel in a more complete state, showing the dividing wall and its window, demonstrating that the tomb was originally visible from the adjoining chapel. A digital reconstruction is needed to measure what kind of view was offered by that window in order to more fully incorporate this space into our understanding of commemoration in Byzantine Cappadocia. Recent scholarship on multi-sensory worship, celebration of the liturgy, and active use of commemorative portraiture indicate new contexts in which to study the tomb and its donor portraits. I surmise that the painted ceiling is also a liminal space that visually connected the holy dead inside the tomb with living viewers in the adjoining chapel; the cross-shaped ceiling decoration was visible to both, serving as a metaphysical representation of the heavens in a rock-cut chapel beneath the earth.

In its most direct application, this model will serve as a tool to answer specific research questions for my dissertation: what exactly was visible from the chapel through the window (and was a particular vantage point emphasized)? How were viewers in the chapel able to see and interact with the ceiling decoration in the tomb? But the digital output also has potential to be a generative work in itself. Through a broader interpretation of the project, this 3D model will serve as a case study for larger issues through open access availability of the model and an accompanying white paper or article —specifically, it will address the challenges in modeling spaces that have been altered or destroyed—about using widely-available tools with photographs, digital illustrations, and historical drawings.

The heuristic process of model-making can utilize a vast array of tools and methods—from quick experiments with smartphone apps to collaborative projects that adhere to the London Charter.[2] Increased access to tools means that architectural historians are engaging more with augmented reality, making their critical engagement with those tools imperative. Yet many discussions of the modeling process are geared toward readers with scientific or archaeological training. Digital Humanities scholars have begun to address modeling as a kind of design process—one that is not simply replication, but interpretation.[3] My article will add to this discussion by documenting how far humanities researchers can go toward answering architectural research questions with out-of-the-box solutions.

The dissemination of white papers can simplify training and tutorials, streamline budgeting and resource management. Documenting my digital process also brings to the surface the “hidden” digital work that is part of the research process for a traditional, written dissertation chapter. My white paper or article will highlight the decision making process and the intellectual underpinnings that drive decisions about tools, methods, and their reflection of the visual and historical evidence being used. [4] Because the model itself will “live” on an open access website, it can serve as a pedagogical tool and springboard for conversations about modeling, including issues of accuracy and ethics in producing public scholarship that uses data that is uncertain or hypothetical.

This project will expand the canon of Byzantine architecture with an open access model of a seldom-visited Byzantine monument. Archaeologist Giorgio Verdiani has recently demonstrated that 3D renderings are a good way for the public to experience Cappadocian monuments that are no longer accessible.[5] Here, I expand that argument toward reconstructing spaces that are accessible but heavily damaged. Small-scale projects like this have the power to diversify the art historical canon, which is often based on objects for which images and access are widely available. Open access research on heritage sites leads to expanded awareness of preservation and to greater diversity in the art historical canon. By providing funds for software, training, and digital labor, this award would enable me to expand and make wider use of a digital component of my dissertation research as a contribution to public scholarship, arguing for a more diverse art historical canon.

Project scope or requirements: This project combines photogrammetry (modeling that “stitches” together digital photographs) and polygon mesh (illustration-based) modeling for a more comprehensive representation of this chapel than has been built before. The research phase of the project is nearly complete, but the digital model is in very early stages of development.

Work Already Accomplished: After site visits to Cappadocia in 2011 and 2013, I have a collection of digital photographs, sketches, and first-hand descriptions of the existing space. I used these documents with research on secondary sources to write a conference paper that was presented at the 2013 Byzantine Studies Conference. I was able to develop reasonable hypotheses for the conference paper, but I need more concrete visual evidence in order to make a convincing argument in my dissertation chapter about the viewer’s experience in the chapel.

I created an initial model of the space using a trial version of Agisoft Photoscan (photogrammetry method). This method will allow me to create a more accurate floor plan of the chapel and tomb than the one sketched by Jerphanion in the early twentieth century (which is still used by scholars today). However I cannot complete my model using this method because the destroyed wall leaves the space incomplete; there is not sufficient historical photography of both sides of the wall to incorporate historical images into the photogrammetry model.

Remaining Work To Be Done: A polygon mesh model (using tools such as SketchUp or Rhino 3D) will essentially be a digital illustration that traces photographs (both mine and Jerphanion’s) to visually reconstruct the wall between the chapel and tomb. The previous, rough photogrammetry model can serve as background to provide measurements and scale for the illustration. My digital process includes further instruction and tutorials on these tools and further reading on the decision making process. This is an area wherein support from NYCDH centers will be helpful. The final model will precisely demonstrate the point-of-view of Byzantine worshippers from several vantage points in the chapel, providing insight on the relationship of the chapel and tomb during commemorations of the holy dead.

My timetable is to complete the model by April 2016, and the white paper or article about technology and the decision-making process in late spring/early summer.

Budget (in hours and/or cost): 

  • Taxes on award ($250, approximately 25%)
  • Travel to Dumbarton Oaks Photo Archive, to undertake additional research on historical photos of Karabaş Church (bus to DC: $60 round-trip)
  • SketchUp ($49)
  • Rhino 3D ($95)
  • Agisoft Photoscan ($59 for educational license)
  • External hard drive, to use as a scratch disc while assembling the models ($79)
  • Online hosting for the final model (such as Documenting Cappadocia in the New Media Lab, CUNY Academic Commons, or the GC library’s institutional repository: no additional cost)
  • Software training (online tutorials, Lynda.com using a GC subscription, consultations with NYCDH centers: no additional cost)
  • Labor (creating digital model): approximately 45-75 hours
  • Writing article or white paper: approximately 2-4 weeks


[1] For a successful example of digital models that allow for spatial analysis of Roman architecture, see J. J. Dobbins and Ethan Gruber, “Modeling Hypotheses in Pompeian Archaeology: The House of the Faun,” in Proceedings of the 38th Conference on Computer Applications and Quantitative Methods in Archaeology (CAA 2010: Fusion of Cultures, Granada, Spain, 2010), 1–9, https://www.academia.edu/1329259/Modeling_Hypotheses_in_Pompeian_Archaeology_The_House_of_the_Faun.

[2] The London Charter: for the computer-based visualisation of cultural heritage, (2.1, February 2009), www.londoncharter.org

[3] For a discussion of this, see Marie Saldaña, “An Integrated Approach to the Procedural Modeling of Ancient Cities and Buildings,” Digital Scholarship in the Humanities, (Advance Access published June 17, 2015), DOI: http://dx.doi.org/10.1093/llc/fqv013. See also Brandon R. Olson and William R. Caraher, eds., Visions of Substance: 3D Imaging in Mediterranean Archaeology, (Grand Forks, ND: The Digital Press at The University of North Dakota) 2015.

[4] The popularity of Miriam Posner’s writing on this topic attests to the need for more of this genre of writing. Miriam Posner, “How Did They Make That?” Miriam Posner’s Blog, August 29, 2013, http://miriamposner.com/blog/how-did-they-make-that/

[5] Giorgio Verdiani, “Bringing Impossible Places to the Public: Three Ideas for Rupestrian Churches in Goreme, Kapadokya Utilizing a Digital Survey, 3D Printing, and Augmented Reality,” Open Archaeology 1:1 (2015), 131–143. DOI 10.1515/opar-2015-0007

This post describes my capstone project for the NEH-sponsored Institute on Digital Archaeology Method and Practice (#MSUdai) that I attended at Michigan State University in August. I’m cross-posting here from the institute’s website. You can read my application to the institute in a previous post on Documenting Cappadocia.

At its heart, the Digital Catalog of Cappadocian Ceiling Crosses will be a database of my dissertation data, deposited in open repositories and visualized for public dissemination as an interactive catalog of all known monumental ceiling crosses in Byzantine Cappadocia, a region that is now central Turkey. Cappadocian architecture offers one of the largest groups of late antique and medieval ceilings available for study because rock-hewn architecture is fairly durable, and dozens of monuments survive in the region. My dissertation’s underlying argument encourages readers to rethink the use of overhead space and monumental imagery: giant cross imagery placed overhead was designed to manipulate and inspire medieval Christian viewers within the spaces beneath.

The first deliverable from this MSUdai project will be an open data deposit into two repositories called Open Context and KORA. (A secondary contribution will be made to Pleiades, an ancient world gazetteer of places). The data will then receive public-facing visualizations based on the repositories’ built-in features. For instance, Open Context has a graph option, and KORA data can be visualized in a WordPress site using the MATRIX Connect plugin. (Theoretically, the data could be endlessly remixed or visualized in alternate formats such as Storymaps, Scalar, or mbira, but I’m taking Ethan’s advice to keep the scope creep at bay!)

Variations of this project have been in the ether for a while as I’ve learned how to think of art history research as reusable data. At LAWDI (a previous NEH-sponsored event called the Linked Ancient World Data Institute), I was able to recognize how this kind of project could take shape in the larger sphere of ancient world Linked Data, with a goal of a Pleiades contribution. At my home institution, several Graduate Center people and groups—the New Media Lab, Digital Initiatives programs (including the Digital Fellows training funds that helped me get to the institute), Mina Rees Librarians, classmates, and professors—have been incredibly generous with time, advice, and resources toward the digital project taking material shape. With their help, I’ve made some progress, but several areas of decision-making have been stalled.

Why, you might ask, would I need an archaeology institute to weigh in after all that good advice? The short answer is, it takes a village to link some data. A more nuanced answer would include the benefits of working with institute faculty members who not only know data, but who have collected and cleaned and archived archaeological data themselves, and who regularly think about the various levels of specificity (or lack thereof) in field recording. Another direct effect of MSUdai on this project the faculty’s knowledge of technologies, Content Management Systems, and platforms that are designed or have long been utilized for archaeological data.

The aha! moment for me in my new workflow came with the the solution of the long-term archiving of data with a (somewhat) automated workflow into its public-facing visualization, thanks to Eric Kansa’s suggestion. Before the institute, I kept trying to hack the WordPress content management system to use as a database, or to learn Drupal (for its more sophisticated construction data and metadata from the back-end) and then deposit the data somewhere for archiving. My new MSUdai approach is just the opposite: deposit the data in stable repositories, and then use the repositories’ built-in tools to visualize it into WordPress (using the MATRIX Connect plugin) or Open Context’s graphs feature that I can embed into a blog post. With this workflow, the data itself won’t be succeptible to updates (of browsers, platforms, software, etc.) from my end (as WordPress and Omeka are). The work of visualizating it will be simplified and enhanced by using tools that are specifically designed to draw from my chosen repositories.

In a nutshell, my first lesson learned from the capstone project is to start with a stable data deposit and then do all the “fancy” things with visualization. In business or grant-reporting, we’d call the data contribution my minimum viable product. My goal is to document and share my decisions and workflow so that this project can serve as a template for other researchers who would like to contribute small data sets to the wider open data ecosystem.

A.L. McMichael, @ByzCapp
PhD candidate in Art History
The Graduate Center of the City University of New York (CUNY)

In August, I’ll be participating in the Institute on Digital Archaeology Method & Practice which will be held at Michigan State University.* The post below is based on my application and outlines some of my goals for this website and future digital projects. 

Art history prepared me for work in archives, but not caves. In 2011, I participated in a terrific on-site workshop in Cappadocia, Turkey where I took 5000 photos of so-called ‘cave churches,’ filled up six Moleskine notebooks, and returned home with no idea how to manage it all. On the same trip, our group hiked to a church in the Ihlara Valley where we discovered that boulders had smashed a thousand-year-old chapel during heavy rains two weeks earlier. Whoever first stumbled on the remnants of the tenth-century frescoes had tried in vain to protect them with bubble wrap, which was flapping pitifully in a July breeze. The helplessness that came from seeing a crushed church that couldn’t be saved or documented (while I was inadvertently hoarding masses of similar data I couldn’t manage) haunted me for weeks.

So I approached the Graduate Center’s New Media Lab with an idea for a website of research and photos. The ongoing result is Documenting Cappadocia, a website, blog, and accompanying social media presence, and I now think of documentation as a form of preservation, even activism. The lab’s community-based ethos underscores my commitment to public scholarship and open access. The work I’ve done there has also made me reflect on the role of tourism (and its associations with social media) in digital preservation and the inherent need for archaeological training when documenting art in situ.

Documenting Cappadocia was included in the Linked Ancient World Data Institute (LAWDI), where I emphasized the importance of small data sets like mine as part of the larger Linked Data ecosystem. This inspired my in-progress digital dissertation component, which is a catalog of Cappadocian ceiling crosses built as an interactive website, including geospatial data that I plan to submit to Pleiades. I argue that this can be model for turning a common art history trope—that is, the list of images normally relegated to an appendix—into an open access, public facing component of dissertation research that spans beyond the discipline.

During subsequent trips to Turkey and Italy, I’ve been more conscious of metadata, especially while recording written observations, shooting photos, and collecting GPS coordinates on site. However, I’ve reached a plateau in terms of skills development. I need a stronger foundation in managing data, especially in best practices of collecting, cleaning, sharing, and visualizing it. I am still struggling to implement Linked Data and to find more efficient ways to gather and disperse my findings. The mentorship and collaboration of the Institute on Digital Archaeology and Practice would push me across the digital hurdle and acclimate me toward more professionalized fieldwork. While remaining open to suggestion, I’m particularly interested in art or architectural topics with site-specific, geospatial, or three-dimensional connotations for the capstone project.

*The institute is funded by the NEH Office of Digital Humanities and organized by MSU’s Department of Anthropology and MATRIX. I’m also grateful to the CUNY Graduate Center’s Digital Initiatives for travel support.

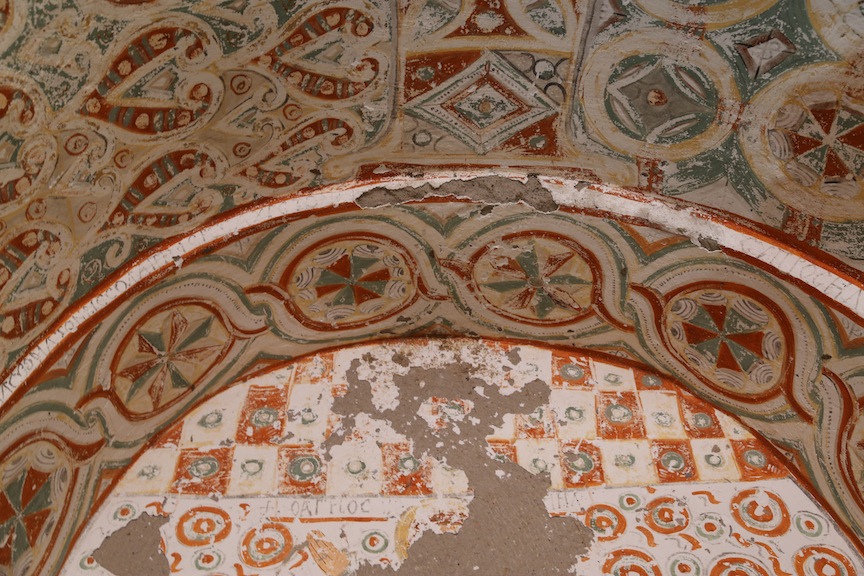
Ihlara Valley, Ağaçaltı Kilisesi, west vault.

Ihlara Valley, Ağaçaltı Kilisesi, west vault. See the Architecture page for more photos.

In the spirit of a new year (and a semester break), this site has lots of new content.

Note the new Essays section with brief encyclopedia-style entries on topics related to Cappadocian art and architecture. The Architecture section now includes gallery posts with photos of Cappadocian monuments. These posts indicate alternate names and translations of the monuments as well as their location (by valley or town). Additional galleries will be rolled out gradually over the next few weeks.

You may also notice updates to the Share and About pages (including rights information), and a “Suggested citation for this page” notice at the end of research-based posts.


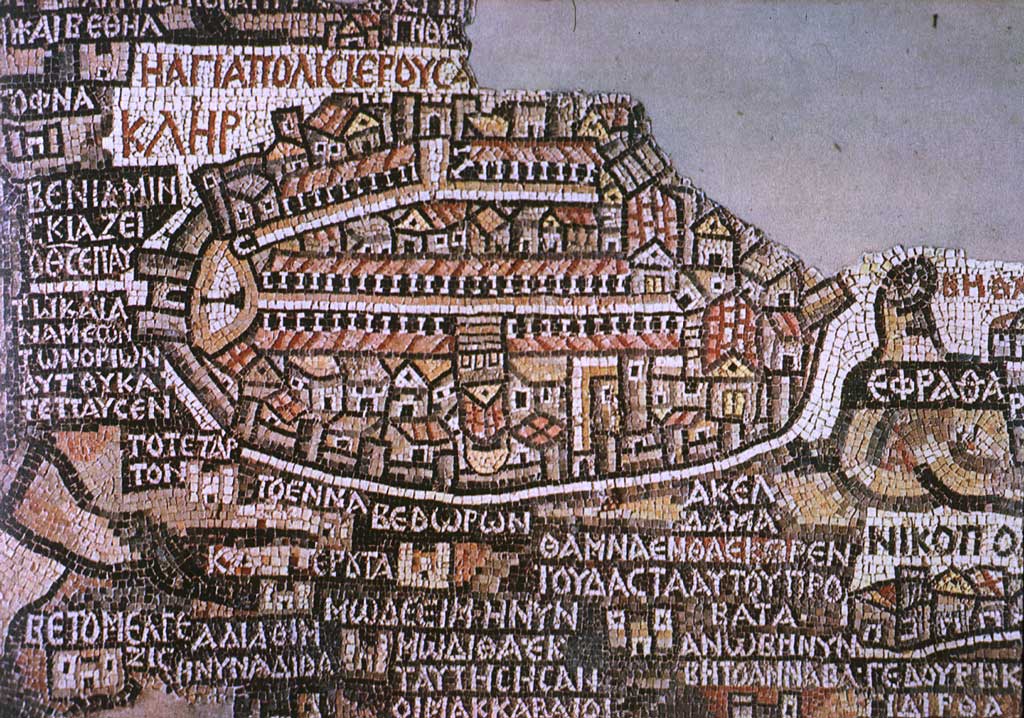
A sixth-century mosaic map on the floor of Saint George church in Madaba, Jordan. Photo via Wikipedia Commons.

In the sixth-century city of Madaba , Jordan, a mosaic floor in Saint George’s church visually unites sacred space with the wider world—Jerusalem, Bethlehem, the Nile River, the Dead Sea are all represented in stone tesserae. The map suggests both devotion and action. Christian visitors who caught a glimpse of this twenty-foot wide mosaic could direct their prayers to God, and the church itself would direct the pilgrims to the Holy Land. Its scenes include cityscapes and houses, bodies of water with fish and boats, people at work. The mosaic was designed from a combination of bird’s eye views and non-linear perspective, letting the visitor’s visual experience shift between omniscient narrator and active participant. According to tradition, Moses gazed at the Promised Land from the top of nearby Mount Nemo. Art historian Antony Eastmond surmises that the Madaba map allowed pilgrims to reenact Moses’ experience by standing in the church and gazing down at the floor map’s image of the Holy Land spread out before them.[1] Maps like this tend to provide an intangible link between the viewer’s body and physical experience and the wider, imagined world, highlighting their participatory nature.

Bridging the gap between tangible, ancient cartographic arts and digital manifestations of them is Measuring and Mapping Space: Geographic Knowledge in Greco-Roman Antiquity, curated by Roberta Casagrande-Kim and Tom Elliott. This exhibition at ISAW (NYU’s Institute for the Study of the Ancient World) explores the work of Greek and Roman geographers, known to us mostly through written sources and copies in medieval and Renaissance manuscripts. The show explores other objects, such as coins with depictions of places, and juxtaposes them with digital components, resulting in a thoughtful and multi-faceted exploration of human relationships and physical space.

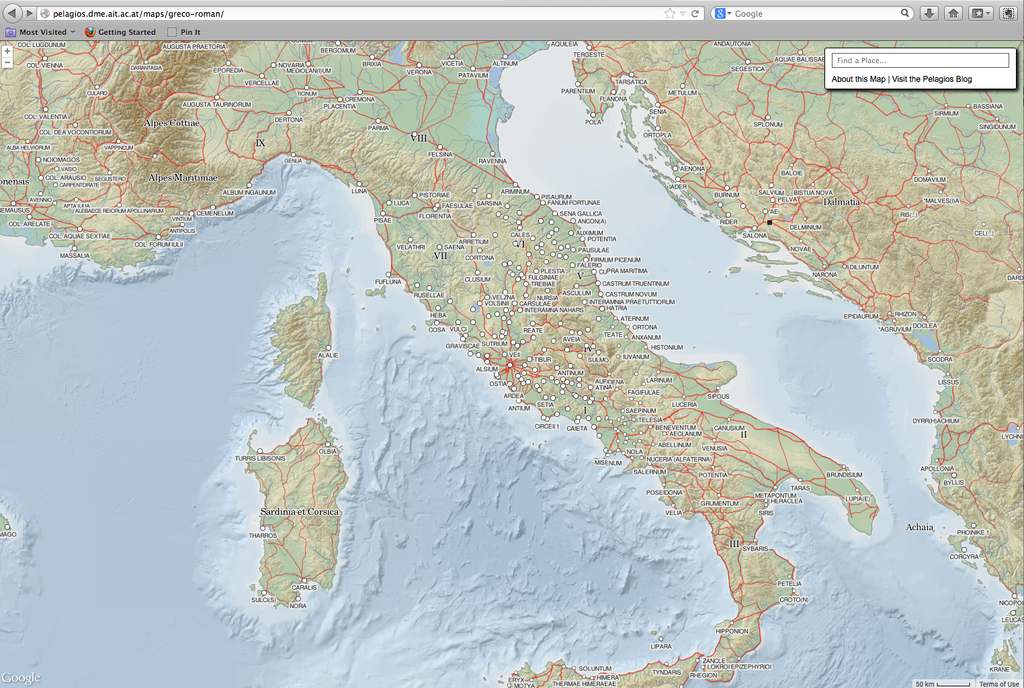
Screenshot of The Digital Map of the Roman Empire on Pelagios.

Fast forward a millennium or so, and one of my favorite online maps is Johan Åhlfeldt’s Digital Map of the Roman Empire on Pelagios. This is the map that made me love digital maps. It includes the Madaba sites and many more. There’s also Antiquity À-la-carte, an interactive GIS application of the Ancient World Mapping Center. In Antiquity À-la-carte, features such as settlements and churches are elegantly placed on a map of the medieval Mediterranean terrain, demonstrating at a glance how ancient communities were connected by roads and rivers. Zoomable, beautifully crafted with open data, and well-documented, this map represents the kind of project that drives both scholarship and public knowledge. I should note that both of these are part of the Pelagios network, a collaboration of around 30 ancient and medieval studies websites that rely on Linked Open Data.

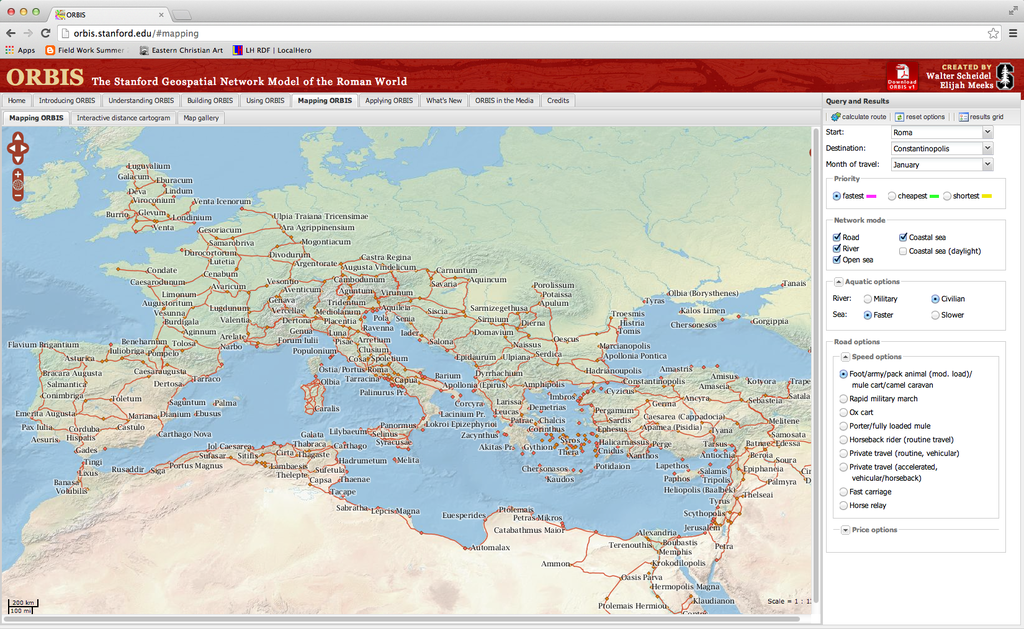
Screen shot of the "Mapping ORBIS" tab of the website.

A similar project, ORBIS, goes beyond map representation to interactive tool. Essentially ORBIS is a travel planner for the ancient world that was created by Walter Scheidel and Elijah Meeks with a team at Stanford University. It goes beyond visualizing the ancient world, allowing users to determine variables and make calculations. I’ve used it in my own research to estimate how long it would take a monk to get from Caeserea, Cappadocia  to Constantinople  (15.8 days by horseback and sea in the month of June, in case you’re wondering). It’s also a good pedagogical tool, as evidenced by John Muccigrosso’s blog post on teaching archaeology.

These were the maps that hurled me into the digital cartography rabbit hole, making me want to understand how these projects actually work. In a juxtaposition of art and science, cartographic projects reflect the thoughtful decisions and interpretative nuances behind representations of geospatial data.

In future posts, I’ll consider issues and research questions as well as tools for making maps. 


[1] Anthony Eastmond, The Glory of Byzantium and Early Christendom. (London: Phaidon Press Ltd., 2013), 108.

The following post is an abstract for my presentation at the 2013 Byzantine Studies Conference held at Yale University from October 31-November 3. For a complete schedule and compilation of abstracts, see the conference program.

An unusual tomb in Karabaş Kilise, a church in the Soğanlı valley.

Commemoration in Cappadocia: A Reexamination of the Tomb Chamber in Karabaş Kilise

A.L. McMichael (CUNY Graduate Center)

A tomb chamber hewn between two chapels in Karabaş Kilise raises questions about preparation for death and the nature of monastic commemoration in Cappadocia. The Karabaş complex is an irregular courtyard arrangement in the Soğanlı valley. Its main church is dated to c. 1061 based on a donor inscription, but the original decoration is probably from the early tenth century, and the remaining four chapels, including the tomb chamber, were dug after that. The church contains a number of burials, including below-ground and arcosolia types, but the tomb chamber is unique among them. A painted cross on the flat ceiling sanctifies the tomb space from above. A shaft accessed through a small window connects the tomb to the apse of the adjoining chapel to the southeast. This paper asserts that a reexamination of the chamber, particularly the window, is needed in order to more fully incorporate this space into our understanding of commemoration in Middle Byzantine Cappadocia.

Guillaume de Jerphanion documented the space in a more complete state, indicating a northeast wall with a small window (no longer extant), demonstrating that the tomb was originally connected to other chapels only by windows. Lyn Rodley recorded paintings and inscriptions before the northeast wall’s partial destruction in the1980s. Four monks, three of whom are commemorated with inscriptions giving the month and day of their death, are painted on the tomb chamber walls. The fourth is depicted in a bishop’s omophorion; his inscription explains that he worked here and died, but it is incomplete and gives no month or day. This could mean that he was the last of the group to die, or that the tomb’s use had ended by the time of his death. Rodley surmises that the windows may reflect the cavity’s previous role as a dwelling space, citing the more probable use of windows by the living (Cave Monasteries 2010). However Robert Ousterhout notes that it bears resemblance to a similar tomb in nearby Kubbeli Kilise and was likely for the burial of an important person (“Remembering the Dead” 2009).

Recent scholarship on multi-sensory worship and commemorative portraiture provides new contexts in which to study the tomb and its donor portraits. While the ceiling cross may have served as a devotional image for the monks in life, I argue that the sanctified burial space was kept active by sounds of commemoration in the memorial space. These activities may have included concelebration of the liturgy or relic collection after the monks’ death. In nearby Zelve, Saint Symeon’s cone (early 10th century) has a comparable ceiling cross and burials in its ground-floor chapel. Its personal/residential areas are dug from the opposite side of the cone and level off into another chapel and an upper dwelling. The excavation and decoration of these personalized chapels would be preparation for eternity, seeming to provide a haven for both the living and the dead.

My last post, “Linked Data for the Uninitiated,” was designed to introduce the concept of Linked Data, a philosophy that constructs information to be readable and useful for both machines and humans on the internet.* As a follow up, I had intended to write a review of good Linked Data and RDF-related plugins but quickly realized the futility of such an exercise–plugins are constantly being updated (or becoming outdated); the needs of individual projects and users differ too greatly for me to have concrete advice; and my own expertise lies outside that area. I’ve touched on plug-ins here, but am focusing instead on openness and general suggestions for incorporating Linked Data principles into projects using an out-of-the-box CMS (content management system). At the end, you’ll find a link to a Zotero bibliography collected in the GC Digital Fellows group geared toward a more technical introduction to Linked Data. (If you have favorite plug-ins, tools, or CMS advice, please weigh in with a comment).

Collecting, sharing, and attributing data
The biggest stumbling block to widespread Linked Data is insufficient digital literacy. W3C’s recent Working Group Document, “Publishing and Linking on the Web,” is evidence of the disconnect between internet use and digital literacy, and ongoing efforts to educate the public. Developers and large institutions will have more complex methods, but I want to emphasize the importance of small-scale or entry-level applications of Linked Data.

As the five-star data model indicates, putting data on the web in an open, machine-readable, non-proprietary format can go a long way toward being a part of the Linked Data cloud. Data presented as a table or text (rather than in a flat image or PDF) is machine readable, searchable, and more useful. Likewise, even in a printed or PDF version, including a permanent URL for the online version is helpful. It’s best to explicitly note how your data was collected, what your policy is for letting others use the data, and a suggested citation so that users will be able to assess your collection methods and reliability of the data provided. A Creative Commons license can be specified for an entire website or a specific kind of data. Leigh Dodds’ Lost Boy blog has some information about attribution and citation of data. And to cover all sides of the issue, Melanie Conroy’s “Linked Data for Individual Use” series on the HASTAC blog touches on the issue of data quality and when you might not want to use Linked Data.

Creating manual hyperlinks to a stable URLs is another simple way to promote Linked Data on any kind of site. Classics librarian Phoebe Acheson has created a practical primer on best practices for linking bibliographic data. She is also the collector of hundreds of bibliographic entries in her Ancient World Open Bibliographies project that includes a blog, wiki site, and public Zotero library. The project pulls together bibliographic data about the ancient world that is openly available on the web and organizes it. Most importantly, entries link to a permanent URI. WorldCat provides a permanent URL for almost any book or publication. Zotero data can easily be shared and offers lots of categories for recording metadata about each item.

Metadata
Metadata is a set of data that gives information about a particular item (a photo or document, for example). A digital camera may record the date and time a photo is taken or the GPS coordinates of the photo’s location. The geographic information could be mapped or contributed to Open Street Map. These pieces of information associated with each photo are the item’s metadata. EXIF data is a kind of metadata recorded by digital cameras. When you open a photo in certain sites (like EXIFdata.com) or software (such as Picasa or Adobe Lightroom).

Using keywords in the “tags” feature of a blog post, photograph, or document is another way to add metadata to files to make them more easily searchable. Some sites, including Flickr, also allow machine-readable tags. Pleiades is an example of a site that utilizes machine tags from Flickr users who would like to participate. Participants can create a machine tag on one of their Flickr photos that corresponds to an ancient site that is mapped in Pleiades. The the Pleiades entry for that ancient location can automatically call up the machine-tagged photo to be displayed alongside the rest of the location data. Tom Elliot has written a post explaining how users can link their Flickr photos to ancient world sites. This is a model that could be used in many other kinds of projects, as explained in the Flickr API forum.

Libraries are often keepers and innovators of metadata. For instance, the Library of Congress records metadata for every object in its collection, displayed in a list, as it does for this photo of Ortahisar, Cappadocia. It also keeps a MARC (machine-readable) record, viewable through a link at the bottom of the record. Museums keep similar records, and any researcher can record similar data. The Dublin Core element set is a list of categories that can be used in conjunction with any item (i.e. a book in a library, or a sculpture in a museum). It is important to denote clearly what you are describing: e.g. the Pantheon in Rome or a photograph of the Pantheon taken last summer. (There can be separate metadata for each). Ideally, each metadata element (in Dublin Core or any other element set) will be completed with a description from a controlled vocabulary, (a pre-determined, widely accepted set of terms). Art historians often look to Getty Vocabularies, and Schema.org is a hub for exploring other options. Useful reflections on interpreting these categories can be found on Lee Ann Ghajar’s blog.

Content Management Systems
Although there’s no simple Linked Data solution for using an out-of-the-box Content Management System (CMS), there are some tweaks and hacks available. Here are a few examples:

  • Omeka, designed with the organization and display of collections in mind, uses Dublin Core to describe items in collections. (There’s hope for an Omeka Linked Open Data plugin as well).
  • Drupal developers are working on ways to integrate Linked Open Data into a site. (See also Joachim Neubert’s work on Linked Data for special collections).
  • WordPress has a number of linked data plugins available, including ISAW’s Ancient World Linked Data for WordPress, which creates a javascript pop-up when you roll over a link. (Click here for examples). There are also RDF and RDFa plugins available. You can also tweak Permalink Settings so that posts and pages have a cleaner, custom URL (without the default question marks and numbers).

considering longevity
Longevity is a crucial aspect of Linked Data that should be considered from the outset of any project. Encouraging others to use your data is a signal that you intended for it to remain available. It is important to decide who will be paying for server access and whether those funds will be available for the foreseeable future. Many academic institutions have repositories that can archive work indefinitely, often hosted by a library or media lab.

“Link rot” is a problem; it’s a nickname for hyperlinks that call up an error message because the original resource has disappeared. Last week, thousands of researchers temporarily lost access to their data while the US Federal Government and its affiliated websites were shut down. While this is not entirely avoidable, it underscores the importance of permanent URIs that allow us to link to reliable data sets that are likely to remain relevant.

conclusions
Linked Data is accomplished through the structure of data as it is put on the web–through constructing clean URIs when building websites; using tools like plug-ins; and even manually adding hyperlinks to a permanent reference. It helps to do the best you can to incorporate Linked Data principles in the planning of the project, from the beginning. Thoughtfully upload data to make sure it can be exported in useful formats. But I’d like to stress that attempting perfection can cripple a project, particularly one with a limited budget and small group. Barriers to entry can be
overcome through collaboration, through institutions like LAWDI or THATCamp, in graduate education and supplementary workshops, and by promoting open access whenever possible.

further reading
More resources for learning about Linked Data are in the GC Digital Fellows Linked Data folder in the new, public Zotero group.


*This essay is cross-posted on “Tagging the Tower,” the GC Digital Fellows blog, with thanks for the time I was able to spend researching the Linked Data bibliography.

This two-part post is my follow-up to LAWDI 2012, officially known as the first Linked Ancient World Data Institute. It brought together a multi-disciplinary group of digital scholars at NYU’s Institute for the Study of the Ancient World (ISAW) whose interests incorporate the Ancient Medierranean and Near East. This essay is cross-posted on the GC Digital Fellows blog.*
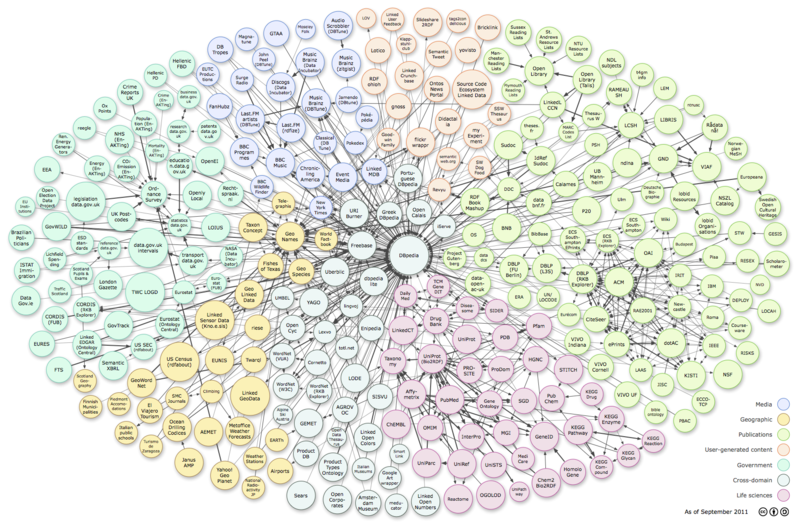
The Linked Data Cloud as of September 2011.

In preparation for LAWDI 2012, I wrote a post called “Linked Data: A Theory,” pondering the concepts behind Linked Data, but it was clear to me from the beginning that I needed a more sturdy vocabulary and concrete skills in order to put these ideas into practice. This essay explores how Linked Data can be useful to digital scholars with any level of technical experience and, ultimately, why it’s worth the trouble to tackle a new skill set while building a digital project.

Linked Data is a philosophy applied to web development. It incorporates best practices through links (that are both human- and machine-readable) to build connections between projects and data sets. The most effective scholarship acts as a springboard for other researchers who cite the work and build on its ideas. To maintain its relevancy, research must be published and shared. The same goes for data collected in support of that scholarship. Linked Data allows institutions and individuals to share resources in order to make data available to many users, all remixing or reinterpreting it to produce new scholarship.

Linked Data is often incorporated into conversations about Open Access, a crucial movement intended to counteract academia’s traditional exclusionary practices by making scholarship freely available to the public. It is also frequently associated with the Open Source movement, referring to projects in which the source code is freely available so that another developer can use that project as the basis for another, often tweaking or adapting it in new ways in a process called forking. This code is often deposited on sites like GitHub for sharing.

The inherent collaborative nature of Linked Data underscores the fact that “links” and “networks” are most useful when they refer to people as well as data. LAWDI has been particularly productive because it brings together people and organizations whose data sets have a good chance of being useful to one another.

LAWDI reading assignments provide a good overview of Linked Data concepts for readers who are familiar with developing or overseeing digital projects. The World Wide Web Consortium (W3C) is a network of organizations led by Tim Berners-Lee (inventor of the world wide web), that develops and recommends standards for best practice in building the Semantic (linked) Web. The W3C website is considered by many to be the gold standard for web-related definitions and explanations. The information below is intended to precede those readings with a more general overview of how those projects are constructed.

Open Data

Linked Data connections are built with Open Data that has been made freely available to reuse or remix. For instance, Europeana and the Digital Public Library of America are huge repositories of data that have made their content available to everyone. (The opposite of Linked Data, by the way, is a “data silo,” a repository that isn’t linked or shared and is unavailable except to those with exclusive access).

Making data open is the first step toward creating Linked Data. It’s essential, of course, to determine rights information before publishing or sharing data.  Archaeologists usually have permission to collect and publish their own findings; bibliographies can generally be shared; museums or archives can choose to share their own collections. Work that is under copyright probably isn’t something that should be shared. Adopting a Creative Commons License is one way to signal that data is available to others who may want to use it. In addition to data being available, it must be structured in such a way that others can use it, preferably at the initial stage of data entry or digitization.

How the Web Operates

At the front end of a website, when the user types a URL (Uniform Resource Locator) into the browser’s address bar, a website is displayed in the browser window.  It does this by calling up the website’s data from a server and translating it into the visual elements displayed on the page.

To fully integrate Linked Data into a project, it is necessary to understand how a digital project is constructed from the ground up. In a nutshell, URIs identify things; RDF describes those things; RDF works within a framework called XML; XML works with HTML; HTML sends information to your browser. In more complex terms, each of these elements operates at the back end of the website to form a series of relationships.

The building blocks of the Semantic Web are URIs (Uniform Resource Identifiers). These are the names of things described on a website. A URI looks like a string of characters that expresses the thing’s filename and/or path to the directory of the file.

A URI always begins with a scheme name followed by a colon and then the remainder of the URI. The scheme name identifies where the data is permanently stored. For instance, a scheme name that begins with “http:” is a web resource, and one that starts with “ftp:” is from an FTP site. Ideally, these URIs should be created from scratch, and not automatically generated by a Content Management System.

A “Cool URI” is an identifier that never changes–the domain name of the website is stable, and the data isn’t moved around or erased or altered. This is important because if someone else links to the data, they need to be certain that the link will remain useful in perpetuity. A “clean URI” clearly describes the item as simply as possible, without superfluous characters or confusing symbols. The Digital Classicist website lists Very Clean URIs with no “cruft,” a term that includes “.cgi”,”.php”,”.asp”,”?”,”&”,”=” or similar characters.

URIs are the basis of a data model called RDF (Resource Description Framework). In an RDF  framework, data is modeled into serializations (such as RDF triples expressing three ideas) in such a way that it is exposed to machine-readers as Linked Data. This data is intended to express relationships between people and/or things, using a controlled vocabulary for consistency among various projects and institutions.

Here’s an example from W3C’s RDF primer: An object whose URI is http://www.example.org/index.html has a creator named John Smith.
The RDF expression of this sentence would structure the data into three ideas:

a subject            http://www.example.org/index.html
a predicate          http://purl.org/dc/elements/1.1/creator
and an object       http://www.example.org/staffid/85740

Note that each of these ideas can be expressed with a URI.

RDF is a framework written in XML** (Extensible Markup Language). Markup languages are systems for annotating data that convey information about an item or instruct the software or web browser on what to display. All RDF triples written in XML are designed to describe data (by marking it up with machine-readable tags) to work in tandem with HTML (HyperText Markup Language), which displays data on the web. Technically speaking, a webpage is an HTML document.

By thoughtfully crafting clean URIs and incorporating them into RDF, a developer can facilitate Linked Data according to Tim Berners-Lee’s four “expectations of behavior” that are nicknamed the Four Rules for Linked Data. Quoted from his site, they are as follows:

  • Use URIs as names for things
  • Use HTTP URIs so that people can look up those names.
  • When someone looks up a URI, provide useful information, using the standards (RDF*, SPARQL)
  • Include links to other URIs. so that they can discover more things.

Berners-Lee calls these “simple.” Perhaps. But they’re not common sense. This leads to the question of whether creating Linked Data is advisable or even possible for a non-developer, an institution with limited resources, or a solo researcher.

In Part 2, I’ll discuss some options for creating Linked Data on a small scale and ways that existing Content Management Systems can be tweaked to be more Linked Data-friendly.


*This post represents a year of stumbling through data in ongoing efforts to become more digitally literate, an adventure supported by a GC Digital Fellowship and participation in the New Media Lab at the CUNY Graduate Center. My heartfelt thanks go out to all of the LAWDI 2012 presenters and participants, particularly Sebastian Heath and Chuck Jones of ISAW who have continued to help me aim for a LAWDI-friendly dissertation, and to Andrew Reinhard of ASCSA for keeping up Lawdite momentum. I’m also grateful to Aaron Knoll, former project advisor in the New Media Lab and overall good egg, for helping with an early draft of this post. Stephen Klein, Digital Services Librarian at the CUNY Graduate Center, has provided links and advice about sustainability. Conversations with Jared Simard about Mapping Mythology and Omeka are always helpful. Matt Rossi is an excellent writing consultant. Flaws and omissions are mine, of course, but it does, indeed, take a village to link data.

**UPDATE 9/13: In the original post, I stated that “RDF works within a framework called XML,” which could be considered an outdated view because linked data can be produced in a variety of formats. The RDF/XML model explained in this post is one example, but not the only option. For instance, RDF can be also written in JSON (JavaScript Object Notation). For a more technical account of RDF use and best practice, see W3C’s RDF primer.

Thanks to Kingsley Uyi Idehen (@kidehen), Hugh Cayless (@hcayless), and Sebastian Heath (@sebhth) for a lively twitter exchange on this topic when Kingsley pointed out that “Linked Data is format agnostic. Basically semantics, syntax, and encoding notations are loosely coupled. No XML or JSON specificity,” (tweet: 6 June from @kidehen).
3 Comments

Çariklı Kilise in Göreme. Photo: Horst Hallensleben, via University of Vienna/Europeana

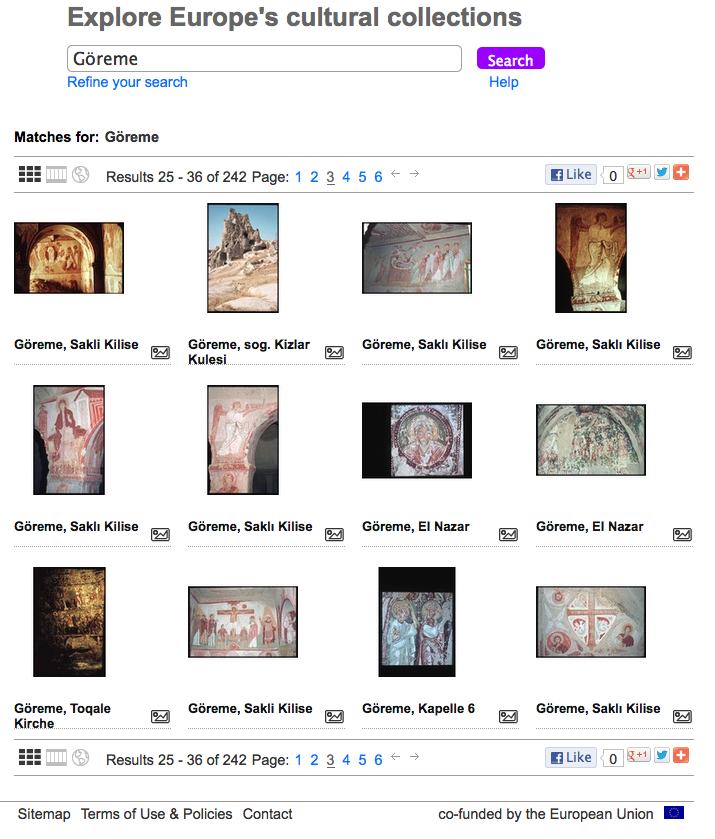
Europeana, a database incorporating many of the European Union’s cultural heritage collections, has added a number of Cappadocian monuments to its vast holdings.

A search for “Göreme” yields over 200 results. Note that you do need to use the Turkish spelling (i.e. include the umlaut over the ö). Most of these are recent additions from the Hallensleben collection, provided by the University of Vienna.*


*Many thanks to Fani Gargova, Byzantine Research Associate at Dumbarton Oaks for bringing this to my attention.